When you come to a fork in the road...
The finale. Not so grand.

“Connect the dots, la la la la. Connect the dots, la la la la!”
Pee-Wee Herman, R.I.P.
(Pee Wee stood atop the apex of pop culture in 1987. We used to be a country.)
Hi, all. Thanks so much for reading this newsletter over the past few months. I have a bittersweet announcement to make. This will be the final edition of “What Else I Learned This Week” as I prepare to embark on a new (but not all that different) career path. I’m so honored that you all subscribed and read each week, and I’m grateful to have had this outlet and this audience over the past few months to expound upon the things I’m passionate about. I hope your weekly macro reading habits will follow me to my next stop, which will be announced on LinkedIn and elsewhere next week.
Now, onto the finale!
August 4th , 2023 - Bottom line up top
Stocks have gotten better at processing “good” news recently, but they still get jittery whenever longer-term interest rates rise, as they did this week. Some but not all of the S&P 500’s rally this year has come from the expectation that interest rates would plateau or even fall. If they don’t, watch out.
“Immaculate cooling” may now be the correct phrase to describe the U.S. labor market. A combination of fewer quits and low layoffs should allow wage growth to normalize back down to the pace we saw in 2018 and 2019.
Keep an eye on the price of oil and other energy commodities. While higher gasoline prices should not change the Fed’s policy trajectory, rising headline inflation could be a headwind for real consumer spending in the coming months.
Keep the other eye on credit conditions. Public markets are still in the soft landing camp, but a high profile bank lending survey this week (SLOOS) showed that conditions continued to tighten last quarter for both consumers and businesses.
Leading indicators have been pointing to slower growth if not outright contraction for nearly 18 months. But many of them are turning positive again before the recession has even happened.
Steady as she goes for the U.S. labor market
The days of U.S. payroll growth blowing the doors off of consensus estimates may be over, but the labor market still looks quite strong. U.S. unemployment fell to a 3.5% rate in July as employment grew faster than labor force participation. Employers added 187,000 new jobs, just below consensus, with the last two months’ estimates revised down moderately. Job creation is slowly slowing, but the employment rate (80.9% for prime age workers) remains at a multi-decade peak.
Average hourly earnings (AHE) growth came in hotter than expected at 0.4% for the month and 4.4% for the past year, which may be due to composition effects as more higher-wage jobs are being added relative to lower-wage jobs. This is really the only part of this report that could support at least a consideration of a September rate hike from the Fed, but it will need to see corroboration from other income data. Incomes are clearly rising faster than inflation, which is better than the alternative but carries its own set of problems if left unchecked.
On the bullish-but-dovish side, construction employment remains on a tear. The industry added 19,000 new jobs despite ongoing labor supply constraints. Indeed, the upside surprise to AHE derives mainly from hotter wage growth in manufacturing and construction. Activity data suggests there are still lots of bottlenecks to finishing multi-family housing units, and construction of new factories stemming in large part from the CHIPS Act is at a record high pace.
Of course, this morning’s data was not the only information we received about the U.S. labor market this week. Unemployment claims remain low, with the 4-week and 13-week moving averages beginning to fall again after a few alarming reports in June.
The BLS’ Jobs Openings and Labor Turnover Survey (JOLTS) has delivered inconsistent monthly prints but tends to tell a clear story over time. That story of late has been one of painless normalization in the labor market: fewer job openings and declining rates of job quitting but also record low layoffs:
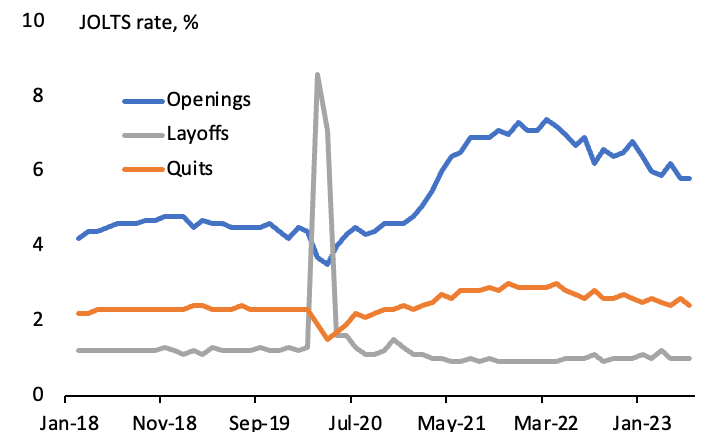
We know from the monthly employment reports that the pace of hiring remains quite brisk relatively to history, but the JOLTS survey also tells us that the churn in the labor market, which felt like a tornado at times in 2020 and 2021, has largely normalized. Layoffs were never high outside of a few months in 2020, but the greatly elevated rate of quits introduce the risk of a wage-price spiral as job switchers tend to see their pay go up more than job stayers. Today, however, the quits rate is almost exactly where it was in 2018 and 2019, as is the unemployment rate.
Not all leading indicators agree about the U.S. economy
A lot of people get into this macro racket thinking they’ll figure out a way to predict where the economy is headed and then use that incredible power to forecast stock market returns, raining gold down on their clients and themselves in the process. But they soon find themselves doing the opposite, tracking stock market behavior to help shape their economic outlooks. That’s because the stock market, like many financial markets, is a leading economic indicator. If you don’t believe me, ask the Conference Board, which has included the S&P 500 Index in its index of Leading Economic Indicators (LEIs) since the early 1900s.
Of course, stocks are only one of many LEIs. The inverted yield curve, unemployment claims and capital goods orders are just a few of the others. The Conference Board uses ten and has been nailing recession calls since the Nixon administration:

As you can see, it’s looked for some time like we’re due for a recession. LEIs peaked way back in March 2022, and every monthly print since then has been negative. Before this cycle, the longest lag from peak LEI to recession has been 22 months. This means that based purely on LEIs, we should expect a recession in either the current quarter or the next one.
I know you’re all hoping there’s a “but”, and there is. Yes, the yield curve (the 10-year Treasury yield less the federal funds rate) is still inverted even after this week’s big steepening. But other leading indicators are actually looking pretty good. Jobless claims have stopped rising, and public credit markets have loosened considerably. Consumer expectations have been on the upswing. And the New Orders subindex of the ISM Manufacturing PMI has risen over the past two months to its highest level since October. So what are we supposed to believe?
Yeah, we have to wait for more data. How convenient that this is my last newsletter, so I get to be the George R.R. Martin of macro commentators and never actually finish this cycle. But let’s sharpen our pencils a little bit to focus on the PMI, because this is a high-profile tension in macro world at the moment. The S&P 500 Index and the ISM Manufacturing PMI are both considered leading indicators, and as such they’re fairly closely correlated over time:

The ISM doesn’t predict equity market moves. It moves in tandem with stocks, which has made it a good leading indicator for the overall economy. But the two don’t always agree. Take a look at the green circles on this chart, which show periods in which stocks haven risen while the PMI was falling. We’re in one of the circles right now. The PMI has staged a brisk but orderly decline since its peak in March 2021. It ticked up slightly in July but remains near its post-GFC low point excluding the early Covid months. U.S. stock prices have clearly taken a different path, bottoming in Q3 2022 and recently returning to solidly positive territory on a rolling 12-month basis.
One of these leading indicators is giving us a false signal. For a clue as to which one, let’s look at the other two “divergent” green circles. They are:
1995 - the only other “soft landing” on record. The Fed paused after raising rates aggressively to fend off inflation, leading stocks and bonds to rally in tandem. The U.S. didn’t have a recession for another five years and market returns during that time were phenomenal. The PMI finally got the memo in the beginning of 1996 that all would be well and it spent the next four years climbing to its eventual cyclical peak.
2006-2007 - stocks hit all-time highs just months before the worst market crash and economic crisis in our lifetimes. The PMI had already peaked way back in November 2005. Business owners saw it coming even if investors didn’t.
Well! Those are two very different case studies. How can we tell whether we’re currently in 1995 or 2007? There’s evidence in both directions.
1995:
Productivity growth — a dicey and oft-revised measure that is often over-interpreted — is at least heading in the right general direction, rising 1.3% over the past year and at a blistering 3.7% pace in Q2 alone.
Inflation has come down quite quickly and appears set for further deceleration through at least the middle of 2024 and possibly thereafter depending on whether real growth slows further (and where its “potential” really lies).
There does not appear to be a significant asset bubble akin to home prices in 2005-07, although stocks remain in historically expensive territory vs. bonds.
2007:
Public markets are complacent, valued at very expensive levels and actually bottomed and began to rally while the Fed tightening cycle was still going on.
Banks are tightening lending standards to a degree we’d only expect to see if the economy was already in recession. Demand for those loans is also falling.
The Treasury yield curve has been inverted for well over a year.
The verdict? I remain optimistic but need to see more. I’m looking forward to analyzing and writing and speaking about all of this. It just won’t be here.
What to watch for over the next week (even though I won’t cover it)
U.S. inflation data will probably not show a significant year-on-year deceleration like it did last month. But that’s mainly because inflation was tame in July 2022. Base effects can be misleading, but the one-month changes to CPI and PPI — as well as the annualized changes over the last three-to-six months — tell us more about inflation’s momentum.
What else I learned last week
I learned that it was really mean to tell my 10-year old that we declined her offer letter from Hogwarts because she got a little homesick at sleep away camp last week. But I did it, anyway.
I learned that with two weeks to go until our family trip to Europe, and having submitted my 5-year old’s passport application back in March, the State Department just came through and sent it without me even having to call. Phew!
I learned that rumors Chelsea might be bidding for USMNT star Tyler Adams has changed the entire jersey-buying strategy in the Nick households for the 2023-24 season.
I learned that my kids have a love-hate relationship with the ocean. Coaxing them back into the water after they get tossed around by a wave was my primary parenting responsibility for about four hours on Sunday.
I learned that Spamalot is coming back to Broadway, and even though it’s completely inappropriate for my Python-obsessed 8-year old, I kind of feel like I have to take him.
Good morning,
Brian
Oh, and in case I don’t see you, good afternoon, good evening and good night.